Saturday, March 27, 2010

Study Session 7 - Financial Reporting and Analysis

Reading 29: Financial Statement Analysis: An Introduction

a. discuss the roles of financial reporting and financial statement analysis;


  • The role of financial reporting is to provide a variety of users with userful information about a company's performance and financial position.

  • The role of financial statement analysis si to use the data from financial statements to support economic decisions.

b. discuss the role of key financial statements (income statement, balance sheet, statement of cash flows, and statement of changes in owners’ equity) in evaluating a company’s performance and financial position;


  • The income statement shows the results of a firm's business activities over the period. Revenues, the cost of generating those revenues, and the resulting profit or loss are presented on the income statement.

  • The balance sheet shows assets, liabilities, and owner's equity at a point in time

  • The cash flow statements shows the sources and uses of cash over the period

  • The statement of changes in owners' equity reports the amount and sources of changes in the equity owners' investment in the firm


c. discuss the importance of financial statement notes and supplementary information, including disclosures of accounting methods, estimates, and assumptions, and management’s discussion and analysis;

  • Important information about accounting methods, estimate, and assumptions is disclosed in the footnotes to the financial statements and supplementary schedules.
  • These disclosures also contain info about segment results, commitments and contingencies, legal proceedings, acquisitions or divestitures, issuance or stock options, and details of employee benefit plans
  • Management's Discussion and Analysis contains an overview of the company and important info about business trends, future capital needs, liquidity, significant events, and significant choices of accounting methods requiring mgmt judgment


d. discuss the objective of audits of financial statements, the types of audit reports, and the importance of effective internal controls;

  • audit is to provide an opinion on the statements' fairness and reliability - unqualified, qualified, adverse
  • opinion gives evidence of an independent review that verifies that
  • appropriate accounting principles were used,
  • that standard auditing procedures were used to establish reasonable assurance that the statements contain no material errors,
  • and that management's report on the company's internal controls has been reviewed.
  • company's management is responsible for maintaining effective internal control system to ensure the accuracy of financial statements
  • for US Public Companies, Sox requires management report on firm's internal controls, description of the method used to evaluated their effectiveness, and a statement as to their effectiveness over the accounting period

e. identify and explain information sources other than annual financial statements and supplementary information that analysts use in financial statement analysis;

  • Along with financial statements, important info sources are:
  • company's quarterly and semi-annual reports,
  • proxy statements (info about board members, stock options, compensation),
  • press releases as well as information on industry and peer companies from external sources

f. describe the steps in the financial statement analysis framework.

  1. state the objective of the analysis
  2. gather data
  3. process the data
  4. analyse and interpret the data
  5. report the conclusions or recommendations
  6. update the analysis


Reading 30: Financial Reporting Mechanics


a. explain the relationship of financial statement elements and accounts, and classify accounts into the financial statement elements;

Transactions are recorded in accounts that form the financial statement elements:
  • Assets - the firm's economics resources
  • Liabilities - creditor's claims on the fimr's resources
  • Owner's equity - paid in capital (common and preferred sotck), retained earnings, and cumulative other comprehensive income
  • Revenues - sales, investment income, and gains
  • Expenses - COGS, selling and admin expenses, depreciation, interest, taxes, and losses

b. explain the accounting equation in its basic and expanded forms;
  • basic accounting equation:
    assets = liabilities + shareholders' equity

  • expanded accounting equation:
    assets = liabilities + contributed capital + ending retained earnings

  • also:
    assets = liabilities + contributed capitals + beginning retained earnings + revenue - expenses - dividends

c. explain the process of recording business transactions using an accounting system based on the accounting equations;

  • Keeping the accounting equation in balance (A-L=E) in balance requires double entry accounting i.e. every transaction is recorded in at least two accounts that offset one another;

  • e.g. an increasse in an asset account must be balanced by a decrease in another asset account or by an increase in a liability or owner's equity account


d. explain the need for accruals and other adjustments in preparing financial statements;


  • firm must recognise revenues when they are earned and expenses when they are incurred;

  • accruals are required when the timing of cash flows in and out do not match timing of the revenue or expense recognition on the financial statements e.g. wages or unearned revenue

e. explain the relationships among the income statement, balance sheet, statement of cash flows, and statement of owners’ equity;

  • balance sheet shows a company's financial position at a point in time

  • changes in balance sheet accounts during an accounting period are reflected in the income statement, the cash flow statement, and the statement of owners's equity

f. describe the flow of information in an accounting system;

  1. info enters accounting system as journal entries

  2. sorted by account into general ledger GL

  3. trial balances are formed at the end of an accounting period

  4. accounts are then adjusted and presented in financial statements

g. explain the use of the results of the accounting process in security analysis.


  • financial reporting requires choices of method, judgment and estimates

  • analyst must understand the accounting process used to produce the financial statements in order to understand the business and the results for the period

  • analysts should be alert to the use of accruals, changes in valuations, and other notable changes that may indicate management judgment is incorrect or that the financial statements have been deliberately manipulated


Issues from Problem Sets


I find expenses versus liabilities confusing in certain cases. I also find contra-assets confusing


  • accumulated depreciation and allowance for bad debts are both assets (since they are contra assets to offset the corresponding asset)

  • depreciation is an expense

  • deferred tax items - deferred tax assets are assets and deferred tax liabilities are liabilities

Reading 31: Financial Reporting Standards

a. explain the objective of financial statements and the importance of reporting standards in security analysis and valuation;
  • objective of financial statements = to provide economic decision makers with useful information about a firm's financial performance and changes in a financial position
  • reporting standards ensure comparability and narrow reasonable estimates on which statements are based
  • users of financial statemetn rely on them for info about the company's activities, profitability, and creditworthiness

key SEC filings:

  • S-1 prior to sale of new securities
  • 10-K annual filing similar to annual report; 40-F for Canadians; 20-F for other foreign issuers
  • 10-Q quarterly unaudited statements
  • DEF-14A company prepares a proxy statement
  • 144 issue of unregistered securities to certain qualified buyers
  • 3,4 and 5 beneficial ownership of securities by company's officers and directors; learn about purchases by insiders

b. explain the role of standard-setting bodies, such as the International Accounting Standards Board and the U.S. Financial Accounting Standards Board, and regulatory authorities such as the International Organization of Securities Commissions, the U.K. Financial Services Authority, and the U.S. Securities and Exchange Commission in establishing and enforcing financial reporting
standards;

  • standard setting bodies are private sector organisations that establish financial reporting standards e.g. IASB (international i.e. IFRS) and FASB (US i.e. GAAP)
  • regulatory authorities are gov agencies that enforce compliance with financial reporting standards e.g. SEC in USA and FSA in UK. Many belong to Interntational Organisation of Securities Commissions (IOSCO)

c. discuss the ongoing barriers to developing one universally accepted set of financial reporting standards;

  • barriers to convergence = differences of opinion among standard-setting bodies and regulatory agencies from difference countries and political pressure within countries from groups affected by changes in reporting standards

d. describe the International Financial Reporting Standards (IFRS) framework, including the qualitative characteristics of financial statements, the required reporting elements, and the constraints and assumptions in preparing financial statements;

  • IFRS "Framework for the Preparation and Presentation of Financial Statements" defines the qualitative characteristics of financial statements, specifies the required reporting elements, and notes the constraints and assumptions involved in preparing financial statements
  • Qualitative characteristics of financial statements include understandability, relevance, reliability, and comparability
  • Elements of financial statements are assets, liabilities, and owners' equity (for measuring financial position) and income and expenses (for measuring performance)
  • Constraints on financial statement preparation include cost, the need to balance reliability with timeliness, and the difficulty of capturing non-quantifiable information in financial statements
  • the two primary assumptions: (1) accrual basis and (2) going concern assumption

e. explain the general requirements for financial statements;

required financial statements are (as expected):

  • balance sheet
  • income statement
  • cash flow statement
  • statement of changes in owners' equity
  • explanatory notes

Principles for preparing financial statements stated in IAS No. 1 are:

  • Fair presentation
  • going concern basis
  • accrual basis
  • consistency between periods
  • materiality
  • aggregation (like with like, no mixing of dissimilar items)
  • no offsetting (unless required or permitted specifically to do so)
  • classified balance sheet showing current and non-current assets and liabilities
  • minimum required information e.g. bs must show specific items such as cash and cash equivalents, plant property and equipment, and inventories; income statement must show revenue, profit or loss, tax expense, and finance costs, etc.
  • comparative information

f. compare and contrast key concepts of financial reporting standards under IFRS and alternative reporting systems, and discuss the implications for financial analysis of differing financial reporting systems;

IFRS and GAAP usually agree in overall framework and purpose and are working toward convergence, however:

  • IFRS requires users to consider framework in the absence of specific standard;
  • US GAAP distinguishes between objectives for business and non-business entities;
  • the IASB framework gives more emphasis to the importance of the accrual and going concern assumptions than FASB
  • GAAP framework establishes a hierarchy of qualitative financial statement characteristics;
  • some differences in how each defines, recognises, and measures individual elements of financial statements
  • companies reporting under standards other than GAAP that trade in USA must reconcile their statements with GAAP but the analyst must reconcile differences in other cases.

g. identify the characteristics of a coherent financial reporting framework and barriers to creating a coherent financial reporting network;

  • A coherent financial reporting framework should exhibit transparency, comprehensiveness and consistency
  • barriers to coherent framework include issues of valuation, standard setting and measurement

h. discuss the importance of monitoring developments in financial reporting standards and of evaluating company disclosures of significant accounting policies.

  • an analyst should be aware that sh*t changes and new stuff doesn't always fit neatly into the categories i.e. these are living documents in many ways
  • under IFRS and GAAP, companies must disclose accounting policies and estimates in the footnotes and MD&A
  • public companies are also required to disclose the likely impact of recently issued accounting standards on their financial statements


Tuesday, March 16, 2010

Study Session 14 - Industry and Company Analysis

An Introduction to Security Valuation and Industry Analysis

Two basic valuation techniques:

  1. valuation based on PV of expected future cash flows
  2. relative valuation based on expected multiple of firm's expected performance e.g. earnings per share or sales per share (more appropriate when market itself is neither severely under or over valued)
  • if firm pays dividends and is mature (growth is stable), use PV of expected future dividends discounted at the cost of equity
  • if firm does not pay dividends, use PV of operating free cash flow or free cash flow to equity discounted at WACC

LOS 56a - Explain the top-down approach, and its underlying logic to the security valuation process

go from general to specific in your evaluation:

  • economic analysis -> industry analysis -> stock analysis
1. Forecast Macroeconomic Influences

aggregate demand may be affected by:

  • fiscal policy
  • tax cuts (increases demand)
  • tax increases
  • government spending (increases demand)
    Monetary policy can have many effects:
  • decrease in money supply = interest rate rise = costs rise = demand shrinks
  • increase in money supply = interest rate fall = costs fall = demand grows
  • increase money supply too quickly can cause inflation
  • rising interest rates reduce demand for investment funds
2. Determine Industry Effects

  • Identify industries that should prosper or suffer from the economic outlook
  • are the industries sensitive to economic change?
  • are they cyclical industries?
3. Perform firm analysis

  • Compare firms within each attractive industry from #2 using financial ratios and cash flow analysis
  • or, if shorting, identify those that should suffer
  • not only past performance, but prospects

LOS 56b - State the various forms of investment returns

many forms:

  • cash flows from projects
  • interest income on bonds
  • dividend income on stocks
  • capital gains (increase in the price of an asset)
  • earnings per share
  • operating cash flow

LOS 56c: Calculate and interpret the value of both a preferred stock and a common stock using the dividend discount model

Valuing perferred stock is like valuing a perpetuity:

  • pref. stock value = Dp/kp
where kp is the discount rate i.e. the yield on the preferred shares

NB do not confuse the dividend rate with the discount rate or the par with the price

default risk involved means that firm's required rate on perferred (kp) should be above the firms bond rate but the fact that 80% of dividends are tax exempt means that they preferred yields are below the yields on the firm's highest grade bonds

We are calculating what the price "should" be i.e. its instrinsic value


One year holding period so this is just the holding period return i.e. the future expected sum of the dividend and the stock price discounted at the required rate of return ke (which can be found using CAPM)

  • value = (dividend to be rec'd/(1 + ke)) + (year end price/(1 + ke))

so predict the year end dividend to be received (D1) by multiplying prior dividend by 1 + g

Two year holding period so this is just like valuing a bond in some ways. It is the NPV of all the cash flows where the final cash flow is the sum of the final dividend plus the stock price (all discounted at ke)

Infinite Period DDM is just like valuing a perpetuity because that is exactly what it is for firms with a constant growth rate so...

  • PVo = D1/(ke - g)
  • where D1 is D0 multiplied by 1 + g
  • rearranging the terms we get ke = (D1/PVo) + g which we have seen in WACC analysis
  • also note that this is the same as valuing preferred stock but where g = 0

relationship between ke and g:

  • As difference between ke and g widens, the value of the stock falls and vice versa
  • Small changes in ke and g cause large changes in stock's value

assumptions of the infinite period DDM

  • stock pays dividends and they grow at a constant rate
  • constant growth rate g is never expected to change
  • ke must be greater than g if not the math will not work

if any of these assumptions is not met, the model breaks down

NB look for words like "indefinitely", "forever", "infinitely" to determine infinite DDM. Also look for words like "just paid" or "recently paid" for ref to last dividend and "will pay" or "is expected to pay" for D1.

value of a Common Stock for a Company Experiencing Temporary Supernormal Growth

  • value = (D1/(1+ke)) + (D2/(1+ke)2) + ... + (Dn/(1+ke)n) + (Pn/(1+ke)n)
  • where:
  • Dn = last dividend of supernormal growth period
  • Dn+1 = first dividend that will grow at constant rate g forever
  • Pn = Dn+1/(ke - g)

this is actually intuitive: find the NPV of the supernormal growth period and add it to the infinite DDM value (discounted for the number of periods away from t = 0) of the post supernormal (stable) period to obtain the value.

watch out i often mess up by how many periods i should discount the perpetuity part of this equation because it is misleading. Discount back the number of periods that there is supernormal growth e.g. if you have two dividends during the supernormal period and then a dividend at the constant growth rate, find the value of the perpetuity and discount back two periods.

if dividends are not paid during the supernormal growth period, you need only find the PV of the infinite DDM for the stock and dividend when the stable period begins

LOS 56d: Show how to use the DDM to develop an earnings multiplier model and explain the factors in the DDM that affect a stock's price-to-earnings (P/E) ratio

DDM related to P/E like this: take the infinite DDM model where P0 = D1/(ke - g) and divide both sides by next year's projected earnings E1 and you get:

P0/E1 = ((D1/E1)/(ke - g))

So P/E is a function of:

  • D1/E1 = the expected dividend payout ratio
  • k = the reuqired rate of return on the stock
  • g = the expected constant growth rate of dividends

So ceteris paribus the P/E ratio will increase with:

  1. a higher dividend payout rate
  2. a higher growth rate
  3. a lower required rate of return

key facts about earnings multiplier approach to valuation is that:

  • the main determinant of size of the P/E ratio is the difference between k and g since it has a significant impact on sotkc price
  • the relevant P/E ratio is the expected or leading P/E ratio i.e. P0/E1 not the historical P/E ratio
  • the P/E ratio is just a restatement of the DDM, so anything that influences stock prices in the DDM will have the same effect on the P/E ratio

problems with using P/E analysis

  • Earnings are historical cost accounting numbers and may be of differing quality
  • Business cycles may affect P/E ratios
  • like infinite DDM, when k <>

LOS 56e: Explain the components of an investor's required rate of return (i.e. the real RFR, the expected rate of inflation, and a risk premium) and discuss the risk factors to be assessed in determining an equity risk premium for use in estimating the required return for the investment in each country

  • RFRreal is determined the supply and demand for capital in the country i.e. the RFR is the rate investors would require if there were absolutely no risk or inflation
  • inflation premium (IP) is the premium required to compensate investors for expected loss of purchasing power
  • a risk premium (RP) to compensate for the uncertainty of returns expected from an investment.
  • RFRnominal is approximated as RFR + IP
  • so required return = (1+RFRreal)(1+IP)(1+RP)-1
  • or approx. RFRreal + IP + RP
  • so CAPM (required return) is just RFRnominal + beta adjusted risk premium
  • a real rate is without inflation, nominal rates include inflation. if it doesn't specify, it is probably nominal

Estimating required return for foreign securities

variables and models are the same world over but the equity risk premium for foreign securities must take into account:

  1. Business risk - variability of country's economic activity and degree of operating leverage of firms within the country
  2. Financial risk will be different in different countries
  3. Liquidity risk is often found in countries with small or inactive capital markets
  4. Exchange rate risk
  5. Country risk from unexpected economic and political events

LOS 56f: estimate the dividend growth rate given the components of the required rate of return incorporating the earnings retention rate and current stock price

g = (RR)(ROE)

which makes sense since growth will be determined by how much money is retained (RR) by the company and plowed back in to fuel growth

Since Retention Rate (RR) is the money kept back, it follows that (1-RR) is the dividend payout

ROE = net profit margin * asset turnover * financial leverage

key facts about dividend growth:

  • if a firm's net profit margin increases, ROE will increase
  • if ROE increases, g will increase because g is (RR)(ROE)
  • if g increases, the difference between k and g will decrease
  • if k-g decreases, price of stock will increase

LOS 56g: Describe a process for developing estimated inputs to be used in the DDM, including the required rate of return and expected growth rate of dividends

Dm holds that the value of a share of stock is the PV of its cash flows (including cash flow from sale of stock itself) so it requires three inputs:

  1. estimate of stock's future cash flows i.e. dividends and future price
  2. dividend growth rate
  3. discount rate, which is the appropriate required return on equity

Once PV of the asset has been estimated, compare it to the current market price

Full Example of Application

For XYZ company:

  • stock price = $18
  • earnings per share = $2
  • ROE = 10% (and stable for the future)
  • dividend payout is 40% (and stable for the future)
  • nomrinal RFR i= 7%
  • expected market return = $12
  • Beta for XYZ = 1.2

So...

  1. calculate required return using CAPM: k = 7% + 1.2(12%-7%) = 13%
  2. calculate growth rate: (RR)(ROE)
    so calc RR = (1 - 0.4) = 0.6
    calc (RR)(ROE) = (0.6)(0.10) = 0.06 i.e. 6%
  3. determine last year's dividend: Do = E0(dividend payout) = $2(0.4) = $0.80
  4. determine next year's dividend: D1 = Do (1 + g) = $0.80 * 1.06 = $0.85
  5. Estimate the value using infinite DDM = D1/(k-g) = $0.85/(0.13-0.06) = $12.14
  6. Compare to stock price of $18, you would not buy (and possibly short)

LOS 57: Describe how structural economic changes (e.g. demographics, technology, politics, and regulation) may affect industries

Not sure how far to go into this one because they seem a little obvious e.g younger people in their 20's would consume houses, furniture whereas if older people dominate population, expect uptick in retirement community sales etc. Technology helps and hurts differently based on the technology. Regulation can cause extra costs and decrease in sales or protectionist tariffs can temporarily boost domestic domand.

Trends and lifestyles and cause temporary boons for the item in vogue.

Issues from problem sets

Some of the supernormal growth questions were confusing in their words e.g.

  • "Assume that a stock is expected to pay dividends at the end of year 1 and year 2 of $1.25 and $1.56 respectively. Dividends are expected to grow at 5% rate thereafter. Assuming that ke is 11%, the value of the stock is closest to:"

NB This means that the second dividend is where the stable growth begins i.e. $1.56 is the dividend rate for the normal constant infinite growth period and so you would calculate it using D1/ke-g or $1.56/0.11-0.05 and add it to the $1.25 then discount the sum by 11% over one period (not sure why it is one period rather than one period for the 1.25 and two periods for the stock price).

Price/Earnings Ratio or Earnings Mutiplier

This is not very well explained in Schweser and I'll probably look it up elsewhere to fully understand what its purpose is.

The P/E is sometimes referred to as the "multiple", because it shows how much investors are willing to pay per dollar of earnings. If a company were currently trading at a multiple (P/E) of 20, the interpretation is that an investor is willing to pay $20 for $1 of current earnings

So P/E = ((stock price using infinite DDM)/E) -> I am weak on this use

  • if you don't have dollar amount for a dividend, use the payout rate e.g. 0.6 for the dividend and divide by ke - g
  • P/E ration based on the DDM is:
  • (1-RR)/[k - RR(ROE)]
  • this is just substituting dividend payout rate (1-RR) for D1 and (RR)(ROE) for g to demonstrate the relationship between the features.

COMPANY ANALYSIS AND STOCK VALUATION

Company vs. Stock Analysis

LOS 58a: Differentiate between 1) a growth company and a growth stock 2) a defensive company and a defensive stock 3) a cyclical company and a cyclical stock, 4) a speculative company and a speculative stock, and 5) a value stock and a growth stock

  • Growth company = managers consistently make investments with positive NPV
  • Growth stock = stock consistently outperforms other stocks of equivalent risk
  • NB all of this good stuff may be already priced into the stock price and bandwagon effect can make it an unwise investment; if a stock's intrinsic value is lower than its current price, it can be a growth stock
  • Defensive company = company's earnings are not sensitive to downturns in economy e.g. utility and retail grocery chains.
  • Defensive Stock will not decline as much as the market when the overall market declines (low betas)
  • Cyclical Company earnings tend to follow business cycle e.g. steel, automobile, heavy equipment producers - high levels of fixed costs (business risk) or leverage (financial risk)
  • Cyclical Stock = beta greater than 1, change more than market either up or down
  • Speculative company = risky assets but potential for assets to generate very large earnings e.g. diamond mining, oil exploration, some real estate etc.
  • Speculative Stock = highly likely to have low or negative returns compared to market because almost always overpriced but slight chance of enormous return
  • Growth stock = earnings growth rate of stock;
  • Value stock = stocks that are priced low in relation to their current earnings (rather than expected growth in their earnings) or in relation to the value of their fixed assets, real estate or cash.
  • Value stocks are characterised by low price-book ratios, low price-earnngs ratios, and often high dividends.

LOS 58b: Describe and estimate the expected earnings per share (EPS) and earnings multiplier for a company and use the multiple to make an investment decision regarding the company

EPS can be estimated by ((est. forecast sales * est. net profit margin)/shares outstanding)

  • A company's earnings multiplier (P/E ratio) can be estimated by macroanalysis of the market and the industry or by microanalysis to estimate the company's dividend payout ratio, sustainable growth rate, and required rate of return.
  • if you know the current share price is $32 and dividend will be $0.96 and earnings will be $3 and the year end P/E will be 12 then year end price will be Earnings * P/E = year end expected price or 3 * 12 = $36
  • and HPY is P1-P0+D/P0 so (($36-$32+$0.96)/$32) = 15.5% which is the expected return.
  • NB this is the opposite process to the CAPM problems. Here we are finding the expected return and comparing it to the known required return.
  • To make an investment decision, est. stock's value by multiplying its estimated EPS and expected P/E ratio and compare this value to the current stock price to determine whether under or over-valued

LOS 59a: Discuss the rationals for, and the possible drawbacks to, the use of price-to-earnings ratio (P/E), price-to-book value (P/BV), price-to-sales ratio (P/S), and price-to-cash flow (P/CF) in equity valuation.

All methods are significantly related to long-run average stock returns

Advantages of P/E ratios in valuation:

  • widely used in investment community
  • earnings power is the primary determinant of investment value

Disadvantages of P/E

  • earnings can be negative = useless P/E
  • the volatile, transitory portion of earnings makes the interpretation of P/E ratios difficult for analysts
  • management disretion in accounting practices can distort reported earnings and thus P/E

Advantages of using P/BV

  • usually positive
  • BV more stable than EPS, so more useful than P/E when EPS is very high/low/volatile
  • BV = appropriate measure for firms with primarily liquid assets e.g. banks, insurance, finance, etc.
  • P/BV good for valuing companies that are expected to go out of business

Disadvantages of P/BV

  • does not recognise value of assets not on balance sheet such as human capital
  • can be misleading when there are significant differences in the net balance sheet values of the assets used by the firms being compared
  • diff. accounting conventions can obscure the true investment in the firm made by shareholders
  • inflation and tech change can cause the book and market value of assets to differ significantly

Advantages of using P/S ratios are:

  • the ratio is meaningful, even for distressed firms
  • sales figures are not as easy to manipulate or distort as EPS and BV
  • not as volatile as P/E
  • particularly appropriate for valuing stocks in mature or cyclical industries as well as start up fims with no record of earnings

Disadvantages of using P/S ratios

  • high sales do not necessarily indicate operating profits as measured by earnings and cash flow
  • P/S ratios do not capture differences in cost structures across companies
  • affected by revenue recognition methods (although less prone to distortion than earnings)

Advantages of using P/CF

  • cash flow harder to manipulate than earnings
  • more stable than P/E
  • addresses problem of differences in quality of earnings that arises when using P/E

Disadvantages of using P/CF

  • some items affecting actual cash flow from operations are ignored when the EPS plus noncash charges estimation method is used. e.g. noncash revenue and net changes in working capital are ignored
  • some measure of free cash flow is theoretically perferred to operating cash flow; free cash flow to equity can be used, but can be negative and is generally more volatile than operating cash flow

LOS 59b: Calculate and interpret P/E, P/BV, P/S, and P/CF

  • all are mkt price per share/some income measure per share
  • trailing P/E = mkt price per share/EPS over prev. 12 months
  • leading P/E = mkt price per share/expected EPS over next 12 months
  • P/BV = mkt price per share/book value per share
  • book value of equity = (total assets - total liabilities) - preferred stock
  • P/S = mkt price per share/sales per share
  • P/CF = mkt price per share/cash flow per share
  • cash flow can be CF, FCFE, adjusted CFO or EBITDA

Problem set issues

  • Sometimes you will not be given the share price and will have to work it out first using DDM; clues would be when they give you ke etc.
  • If they give you a date for a dividend and do not give you any other dates, it seems to imply that this is Do so D0 * (1 + g) = D1
  • Sales per share = revenue per share
  • accounting standard differences cause problems for most ratios to varying degrees including P/BV, P/E and P/S (although P/S is less prone to distortion)
  • BV = shareholder's equity
  • calculate margin call price


Monday, March 15, 2010

Calculation Formulas

As I start to freak out a little about this exam and feel that the universe of formulas we are given is just too overwhelming, I thought it would be useful to differentiate between the formulas we are expected to explain/understand versus the formulas we are expected to use to make calculations (which is another way of saying I am procrastination in a way that makes me feel like I am actually doing something).

Below are all the LOS's for CFA Level 1 which refer to computation, estimation, or calculation:

Reading 5: The Time Value of Money
c. calculate and interpret the effective annual rate, given the stated annual interest rate and the frequency of compounding;
d. solve time value of money problems when compounding periods are other than annual;
e. calculate and interpret the future value (FV) and present value (PV) of a single
sum of money, an ordinary annuity, an annuity due, a perpetuity (PV only), and a series of unequal cash flows;
f. draw a time line and solve time value of money applications (for example, mortgages and savings for college tuition or retirement).

Reading 6: Discounted Cash Flow Applications
a. calculate and interpret the net present value (NPV) and the internal rate of return (IRR) of an investment, contrast the NPV rule to the IRR rule, and identify problems associated with the IRR rule;
b. define, calculate, and interpret a holding period return (total return);
c. calculate, interpret, and distinguish between the money-weighted and timeweighted rates of return of a portfolio and appraise the performance of portfolios based on these measures;
d. calculate and interpret the bank discount yield, holding period yield, effective annual yield, and money market yield for a U.S. Treasury bill;
e. convert among holding period yields, money market yields, effective annual yields, and bond equivalent yields.

Reading 7: Statistical Concepts and Market Returns
c. calculate and interpret relative frequencies and cumulative relative frequencies, given a frequency distribution;
e. define, calculate, and interpret measures of central tendency, including the population mean, sample mean, arithmetic mean, weighted average or mean (including a portfolio return viewed as a weighted mean), geometric mean, harmonic mean, median, and mode;
f. describe, calculate, and interpret quartiles, quintiles, deciles, and percentiles;
g. define, calculate, and interpret 1) a range and a mean absolute deviation and
2) the variance and standard deviation of a population and of a sample;
h. calculate and interpret the proportion of observations falling within a specified number of standard deviations of the mean using Chebyshev’s inequality;
i. define, calculate, and interpret the coefficient of variation and the Sharpe ratio;

Reading 8: Probability Concepts
k. calculate and interpret covariance and correlation;
l. calculate and interpret the expected value, variance, and standard deviation of a random variable and of returns on a portfolio;
m. calculate and interpret covariance given a joint probability function;
n. calculate and interpret an updated probability using Bayes’ formula;
o. identify the most appropriate method to solve a particular counting problem and solve counting problems using the factorial, combination, and permutation notations.

Reading 9: Common Probability Distributions
d. calculate and interpret probabilities for a random variable, given its cumulative distribution function;
f. calculate and interpret probabilities given the discrete uniform and the binomial distribution functions;
h. describe the continuous uniform distribution and calculate and interpret probabilities, given a continuous uniform probability distribution;
j. determine the probability that a normally distributed random variable lies inside a given confidence interval;
k. define the standard normal distribution, explain how to standardize a random variable, and calculate and interpret probabilities using the standard normal distribution;
l. define shortfall risk, calculate the safety-first ratio, and select an optimal portfolio using Roy’s safety-first criterion;
n. distinguish between discretely and continuously compounded rates of return and calculate and interpret a continuously compounded rate of return, given a specific holding period return;

Reading 10: Sampling and Estimation
e. calculate and interpret the standard error of the sample mean;
h. explain the construction of confidence intervals;
i. describe the properties of Student’s t-distribution and calculate and interpret its degrees of freedom;
j. calculate and interpret a confidence interval for a population mean, given a normal distribution with 1) a known population variance, 2) an unknown population variance, or 3) an unknown variance and a large sample size;

Reading 13: Elasticity
a. calculate and interpret the elasticities of demand (price elasticity, cross elasticity, and income elasticity) and the elasticity of supply and discuss the factors that influence each measure;
b. calculate elasticities on a straight-line demand curve, differentiate among elastic, inelastic, and unit elastic demand, and describe the relation between price elasticity of demand and total revenue.

Reading 16: Organizing Production
f. calculate and interpret the four-firm concentration ratio and the Herfindahl-Hirschman Index and discuss the limitations of concentration measures;

Reading 22: Monitoring Jobs and the Price Level
d. explain and calculate the consumer price index (CPI) and the inflation rate, describe the relation between the CPI and the inflation rate, and explain the main sources of CPI bias.

Reading 34: Understanding the Cash Flow Statement
h. explain and calculate free cash flow to the firm, free cash flow to equity, and other cash flow ratios.

Reading 35: Financial Analysis Techniques
d. calculate, classify, and interpret activity, liquidity, solvency, profitability, and valuation ratios;
g. calculate and interpret the ratios used in equity analysis, credit analysis, and segment analysis;

Reading 36: Inventories
c. compute ending inventory balances and cost of goods sold using the FIFO, weighted average cost, and LIFO methods to account for product inventory and explain the relationship among and the usefulness of inventory and cost of goods sold data provided by the FIFO, weighted average cost, and LIFO methods when prices are 1) stable, 2) decreasing, or 3) increasing;
f. compute and describe the effects of the choice of inventory method on profitability, liquidity, activity, and solvency ratios;
g. calculate adjustments to reported financial statements related to inventory assumptions to aid in comparing and evaluating companies;

Reading 37: Long-Lived Assets
b. compute and describe the effects of capitalizing versus expensing on net income, shareholders’ equity, cash flow from operations, and financial ratios, including the effect on the interest coverage ratio of capitalizing interest costs;
e. discuss the use of fixed asset disclosures to compare companies’ average age of depreciable assets and calculate, using such disclosures, the average age and average depreciable life of fixed assets;
j. calculate and describe both the initial and long-lived effects of asset revaluations on financial ratios.

Reading 38: Income Taxes
d. calculate income tax expense, income taxes payable, deferred tax assets, and deferred tax liabilities, and calculate and interpret the adjustment to the financial statements related to a change in the income tax rate;

Reading 39: Long-Term Liabilities and Leases
a. compute the effects of debt issuance and amortization of bond discounts and premiums on financial statements and ratios;

Reading 44: Capital Budgeting
d. calculate and interpret the results using each of the following methods to evaluate a single capital project: net present value (NPV), internal rate of return (IRR), payback period, discounted payback period, and profitability index (PI);

Reading 45: Cost of Capital
a. calculate and interpret the weighted average cost of capital (WACC) of a company;
f. calculate and interpret the cost of fixed rate debt capital using the yield-to-maturity approach and the debt-rating approach;
g. calculate and interpret the cost of noncallable, nonconvertible preferred stock;
h. calculate and interpret the cost of equity capital using the capital asset pricing model approach, the dividend discount model approach, and the bond-yield-plus risk-premium approach;
i. calculate and interpret the beta and cost of capital for a project;

Reading 46: Working Capital Management
e. compute and interpret comparable yields on various securities, compare portfolio returns against a standard benchmark, and evaluate a company’s short-term investment policy guidelines;

Reading 50: An Introduction to Portfolio Management
c. compute and interpret the expected return, variance, and standard deviation for an individual investment and the expected return and standard deviation for a portfolio;
d. compute and interpret the covariance of rates of return and show how it is related to the correlation coefficient;

Reading 51: An Introduction to Asset Pricing Models
e. calculate, using the SML, the expected return on a security and evaluate whether the security is overvalued, undervalued, or properly valued.

Reading 56: An Introduction to Security Valuation
c. calculate and interpret the value of both a preferred stock and a common stock using the dividend discount model (DDM);
f. estimate the dividend growth rate, given the components of the required rate of return incorporating the earnings retention rate and current stock price;

Reading 58: Company Analysis and Stock Valuation
b. describe and estimate the expected earnings per share (EPS) and earnings multiplier for a company and use the multiple to make an investment decision regarding the company.

Reading 59: Introduction to Price Multiples
b. calculate and interpret price-toearnings ratio (P/E), price-to-book value (P/BV), price-to-sales ratio (P/S), and price-to-cash flow (P/CF).

Reading 61: Risks Associated with Investing in Bonds
f. compute and interpret the duration and dollar duration of a bond;

Reading 63: Understanding Yield Spreads
e. compute, compare, and contrast the various yield spread measures;
i. compute the after-tax yield of a taxable security and the tax-equivalent yield of a tax-exempt security;

Reading 64: Introduction to the Valuation of Debt Securities
c. compute the value of a bond and the change in value that is attributable to a change in the discount rate;
d. explain how the price of a bond changes as the bond approaches its maturity date and compute the change in value that is attributable to the passage of time;
e. compute the value of a zero-coupon bond;

Reading 65: Yield Measures, Spot Rates, and Forward Rates
b. compute and interpret the traditional yield measures for fixed-rate bonds and explain their limitations and assumptions;
c. explain the importance of reinvestment income in generating the yield computed at the time of purchase, calculate the amount of income required to generate that yield, and discuss the factors that affect reinvestment risk;
d. compute and interpret the bond equivalent yield of an annual-pay bond and the annual-pay yield of a semiannual-pay bond;
e. describe the methodology for computing the theoretical Treasury spot rate curve and compute the value of a bond using spot rates;
h. explain a forward rate and compute spot rates from forward rates, forward rates from spot rates, and the value of a bond using forward rates.

Reading 66: Introduction to the Measurement of Interest Rate Risk
d. compute and interpret the effective duration of a bond, given information about how the bond’s price will increase and decrease for given changes in interest rates, and compute the approximate percentage price change for a bond, given the bond’s effective duration and a specified change in yield;
f. compute the duration of a portfolio, given the duration of the bonds comprising the portfolio, and explain the limitations of portfolio duration;
g. describe the convexity measure of a bond and estimate a bond’s percentage price change, given the bond’s duration and convexity and a specified change in interest rates;
i. compute the price value of a basis point (PVBP), and explain its relationship to duration.

Reading 68: Forward Markets and Contracts
g. calculate and interpret the payoff of an FRA, and explain each of the component terms;

Reading 69: Futures Markets and Contracts
d. describe price limits and the process of marking to market and compute and interpret the margin balance, given the previous day’s balance and the change in the futures price;

Reading 70: Option Markets and Contracts
f. compute and interpret option payoffs, and explain how interest rate option payoffs differ from the payoffs of other types of options;
h. determine the minimum and maximum values of European options and American options;
i. calculate and interpret the lowest prices of European and American calls and puts based on the rules for minimum values and lower bounds;

Reading 71: Swap Markets and Contracts
b. define, calculate, and interpret the payment of currency swaps, plain vanilla interest rate swaps, and equity swaps.

Reading 72: Risk Management Applications of Option Strategies
a. determine the value at expiration, profit, maximum profit, maximum loss, breakeven underlying price at expiration, and general shape of the graph of the strategies of buying and selling calls and puts, and indicate the market outlook of investors using these strategies;
b. determine the value at expiration, profit, maximum profit, maximum loss, breakeven underlying price at expiration, and general shape of the graph of a covered call strategy and a protective put strategy, and explain the risk management application of each strategy.

Reading 73: Alternative Investments
f. calculate the net operating income (NOI) from a real estate investment, the value of a property using the sales comparison and income approaches, and the aftertax cash flows, net present value, and yield of a real estate investment;
h. calculate the net present value (NPV) of a venture capital project, given the project’s possible payoff and conditional failure probabilities;


Wednesday, March 3, 2010

Review Checklist

  • learn as much about my calculator and ways it can help me calculate %change, depreciation, annualising, breakeven point
  • go through all the LOS's for the word calculate or compute and make notecards of those formulas and know them well
  • QBank LOS's in which i am weak and create sample tests to constantly review

Tuesday, March 2, 2010

Study Session 12 - Equity

Reading 52: Organization and Functioning of Securities Markets

a. describe the characteristics of a well-functioning securities market;

  • Timely and accurate information
  • Liquidity
  • Internal efficiency (low transaction costs)
  • External (informational) efficiency i.e. rapid and unbiased price adjustments to new info
b. distinguish between primary and secondary capital markets and explain how secondary markets support primary markets;

  • primary market = newly issued securities (U.S. Treasuries, new issues of common stock)
  • secondary market = market for existing securities (NYSE, Nasdaq etc.)
  • well functioning secondary markets make it easier for firms to raise capital in the primary market as they provide both value information and liquidity
c. distinguish between call and continuous markets;

  • call markets = security trades executed at specific times at a single price and after buy and sell orders have accumulated
  • continuous markets = trading takes place at various prices and times as buy and sell orders arrive
d. compare and contrast the structural differences among national stock exchanges, regional stock exchanges, and the over-the-counter (OTC) markets;

  • stock exchanges are physical places where traders and dealers gather to trade
  • national stock exchanges list the shares of large and well-known firms and have more stringent listing requirements than regional or over-the-counter markets
  • regional stock exchanges trade the shares of local firms (smaller firms) and of some firms also listed on national exchanges
  • OTC market is network of dealers (market makers) in various locations who stand ready to purchase or sell securities at posted prices udring the hours the market is open
e. compare and contrast major characteristics of various exchange markets, including exchange membership, types of orders, and market makers;

  • types of stock exchange members include specialists who act as market makers, traders who provide liquidity by trading for their own accounts and commission brokers and floor brokers who execute public orders
  • import types of orders are market orders (buy/sell at best price available), limit orders (buy/sell at a specific max/min price i.e. buy at price x or less), stop orders (triggers to get you out of or into a position - defensive move usually), and short sales
  • specialists are the exchange market makers that handle the limit order book and maintain an orderly market by buying and selling shares for their own accounts
f. describe the process of selling a stock short and discuss an investor’s likely motivation for selling short;

  • Selling short = borrowing securities and selling them at market price, expecting the price to go back down so you can rebuy them at the lower price and return them to the owner
  • Short seller must pay any dividends to the lender of the securities as they are due and must deposit a margin as a guarantee of payment in the case stock price increases lead to losses on their part
g. describe the process of buying a stock on margin, compute the rate of return on a margin transaction, define maintenance margin, and determine the stock price at which the investor would receive a margin call.

  • in a margin transaction, investors borrow against securities to purchase them, leaving securities at the brokerage house as collateral for the loan
  • the rate of return on margin transactions is calculated as the profit or loss on the security position divided by the cash equity (margin) deposited to make the trade
  • the stock price at which an investor who purchases stock on margin will receive a margin call can be calculated as:
  • trigger price = P0[(1-initial margin)/(1-maintenance margin)]

Reading 53: Security-Market Indexes

a. compare and contrast the characteristics of, and discuss the source and direction of bias exhibited by, each of the three predominant weighting schemes used in constructing stock market indices and compute a price-weighted, a valueweighted, and an unweighted index series for three stocks;
  • s
b. compare and contrast major structural features of domestic and global stock indices, bond indices, and composite stock-bond indices;
c. state how low correlations between global markets support global investment.

Reading 54: Efficient Capital Markets
a. define an efficient capital market and describe and contrast the three forms of the efficient market hypothesis (EMH);
b. describe the tests used to examine each of the three forms of the EMH, identify various market anomalies and explain their implications for the EMH, and explain the overall conclusions about each form of the EMH;
c. explain the implications of stock market efficiency for technical analysis, fundamental analysis, the portfolio management process, the role of the portfolio manager, and the rationale for investing in index funds;
d. define behavioral finance and describe prospect theory, over-confidence bias, confirmation bias, and escalation bias.

Reading 55: Market Efficiency and Anomalies
a. explain the three limitations to achieving fully efficient markets;

Study Session 12 - Portfolio Management

PORTFOLIO MANAGEMENT

The Asset Allocation Decision

LOS 49a: describe the steps in the portfolio management process and explain the reasons for a policy statement


  1. write policy statement = goals, constraints, itemised risks taken to meet goals
  2. develop investment strategy to satisfy policy goals
  3. implement plan = construct portfolio and allocation of assets
  4. monitor and update
policy statement is articulation of agreement that both parties have understood one another; imposes investment discipline on portfolio manager; portfolio should be measured against benchmark rather than raw returns

LOS 49b: Explain why investment objectives should be expressed in terms of risk and return and list the factors that may affect an investor's risk tolerance


  • Investment objectives should be expressed in tersm of risk and return so investor is aware of both and can make sound decisions.
  • return objectives may be stated in absolute terms, or as pre-tax or after-tax percentage returns
  • return considerations also cover capital preservation, capital appreciation, current income needs, and total returns
  • risk tolerance is a function of investor's psychological make up and personal factors such as age, family situation, existing wealth, insurance coverage, current cash reserves and income
LOS 49c: Describe the return objectives of capital preservation, capital appreciation, current income, and total returns


  1. capital preservation = equal to inflation, little/no risk, no decrease in purchasign power
  2. capital appreciation = e.g. saving for retirement, nominal return should exceed rate of inflation
  3. current income = primary purpose is to generate income as opposed to capital appreciation e.g. supplement other income such as living expenses or in retirement
  4. total return = have portfolio grow in value to meet a future need through capital gains and reinvestment of current income

risk hierarchy = capital appreciation > total return > current income > capital preservation

LOS 49d: describe the investment constraints of liquidity, time horizon, tax concerns, legal and regulatory factors, and unique needs and preferences


  • liquidity = ability to convert investments into cash
  • time horizon (investment horizon) refers to the time between making an investment and needing funds; lower-risk investments are better if you have short time horizons
  • tax concerns = after-tax returns are what investors should be concerned with. interest and dividends and capital gains all taxed at the same rate. Taxes on unrealised gains can be deferred indefinitely.
  • trade-off between changing positions to diversify and the tax "cost" of doing so
  • some investments (e.g. munis) are tax exempt
  • tax-deferred investments e.g. IRA, 401(k) and 403(b) - these are good for young investors - and various life insurance contracts
  • retirees may not want tax-deferred options, may want current income max so taxed investments (w/ higher return) may be better than tax-exempt
  • Legal and regulatory factors = more of a concern to institutional investors; penalty for early withdrawal from tax-deferred retirement fund
LOS 49e: Describe the importance of asset allocation, in terms of the percentage of a portfolio's return that can be explained by the target asset allocation, and explain how political and economic factors result in differing asset allocations by investors in various countries


  • 90% of variation in a single portfolio's returns over time can be explained by target asset allocation and 40% of variation in returns acrosss funds can be explained by this
  • differences in returns among asset classes are much more important than differences in security selection in determining overall portfolio returns
  • countries with younger populations have greater avg allocation to equities
  • some countries have legal restrictions on the percentage of equities that various institutions can hold
  • German society has historical aversion to risk and equity ownership is not typical for its citizens
  • countries with higher historical inflation rates tend to have greater investor allocations to equities

Introduction to Portfolio Management

LOS 50a: Define risk aversion and discuss evidence that suggests that individuals are generally risk averse

  • Risk aversion = individuals prefer less risk to more risk; risk averse investors will prefer lower to higher risk for given return and will only accept a riskier investment if they are compensated in the form of greater expected return
  • Indifference curves = for every point of risk (variance) and return (mean) along each curve, the investor is indifferent. Preferred indifference curves will be the curves more to the northwest of the Return and Risk diagrams below since they represent more return and less risk (the preference of the risk averse investor).
  • insurance proves that people are generally risk averse but risk aversion varies based on the topic per person

LOS 50b: List the assumptions about investor behaviour underlying the Markowitz model

  • returns distributions = investors see each investment opportunity as a probability distribution of expected returns over a given investment horizon
  • utility maximisation = investors maximise expected utilitu over given timeline; indifference curves exhibit diminishing utility of wealth (they are convex)
  • risk is variability = variance (standard deviation) of returns
  • risk/return = investors make all investment decisions based on only the risk and return i.e. utility indifference curves are only a function of expected return (mean) and risk (variance)
  • risk aversion = given two investments with equal exp. returns, investors prefer the one with lower risk and if risk is equal, they prefer the one with higher returns

LOS 50c: Compute and interpret the expected return, variance, and standard deviation for an individual investment and the expected return and standard deviation for a portfolio

  • expected return for an individual security = for a risky asset and given probabilities for the return based on (say) different states of the economy, the Expected Return is the sum of exp. return multiplied by the probability of that return occuring.
  • variance (standard deviation) of returns for an individual security = for a risky asset and given probabilities for returns based on (say) different states of the economy, the variance is the sum of (the squared deviations from the mean multiplied by the probability of the return taking place). Standard deviation is just the square root of the variance.
  • expected return for a portfolio of risky assets is the weighted average of the returns on the individual assets, using their portfolio weights (i.e. the percentage of the total portfolio value invested in each asset).

LOS 50d: Compute and interpret the covariance of rates of return and show how it is related to the correlation coefficient

Covariance zero means no linear relationship; positive = they move together;

Covariance = sum of the probability times the product of the deviations from mean for each asset in each probability so COVa,b = Σ{ Pi [Ri,a - E(Ra)][Ri,b - E(Rb)] }

Covariance using historical data will be the n-1 average of the product of the deviations from the mean for the assets i.e. it will be the same as normal covariance except probability is equal to 1 (because it has actually taken place) and so average the returns using simple sample averaging and don't multiply by probability.

  • COV1,2 = P1,2(σ1 σ2) where P1,2 = correlation of Asset 1 and 2
  • Correlation (P1,2) of Asset 1 and 2 = Cov 1,2/(σ1 σ2)
  • The term P1,2 is the correlation coeffecient and is bounded by -1 and +1 with zero being no correlation.
  • zero correlation means that knowing something about how one of the assets moves tells you nothing about how the other will move

LOS 50e: list the components of the portfolio standard deviation formula

  • Var(Rp) = wA2σA2 + wB2σB2 + 2wAwBσAσBCorr(A,B)
  • Standard Deviation (Rp) = square root of Var(Rp)
  • Note: σAσBCorr(A,B) is the covariance(A,B) so if you are not given the Corr, you can find it for the first half of the formula and then substitute the Cov(A,B) after the weights in the second half. Also, this is for a portfolio of only two stocks.
  • for more than two stocks, there will be the same numer of weighted risks in the first half and then the second half would consist of all the different permutations of how all the assets can be paired off and their covariance compared
  • if assets are negatively correlated then last term will be negative and this (naturally) reduces the portfolio standard deviation; if correlation is zero then st. dev. for portfolio is greater than when correlation is negative (which makes sense)
  • NB! The risk of a portfolio of risky assets depends on the asset weights, the standard deviation of the assets' returns, and crucially on the correlation (covariance) of the assets' returns

PORTFOLIO RISK AND RETURN FOR A TWO-ASSET PORTFOLIO

Suppose you have two stocks, A and B. If they are not perfectly positively correlated (i.e. their correlation is less than one or even negative) then mixing the two of them together can create either (a) a portfolio with a lower risk and higher reward than a portfolio with just one of the stocks or (b) a portfolio with the same risk as say stock A but a much higher reward.

This is the principle of diversification: as the correlation between assets decreases, their tendency to move together decreases and, hence, the volatility of the portfolio decreases. The lower the correlation between the returns of the stocks in the portfolio, ceteris paribus, the greater the diversification benefits

LOS 50f: Describe the efficient frontier and explain the implications for incremental returns as an investor assumes more risk

  • We make the assumption of normality because it greatly simplifies the portfolio selection problem.
  • The entire distribution of an individual stock's return can be described by two parameters: the mean and the variance.
  • We can figure out a portfolio's mean and variance by examining the means, variances and covariances of the component securities.
  • Most importantly, we can compare different portfolios on the basis of mean and variance.

Our discussion of utility functions and risk aversion provided two conclusions.

  1. First, consumers like more to less. In terms of a security or portfolio, consumers prefer more return to less return.
  2. Second, consumers like less variance to more variance - the consumer will prefer a portfolio with less variance to another higher variance portfolio with an equal expected return.

We will now consider the effects of diversification. Previously, we combined securities and looked at the effect on the portfolio variance for different correlation coefficients between the securities. We found that using equal weights in the two portfolios, a lower the correlation coefficient led to lower portfolio variance.

To build a Markowitz portfolio, we need:

  1. the expected return for each asset
  2. the standard deviation for each asset
  3. the correlations between every pair of assets

a portfolio is considered efficient if no other portfolio offers a higher expected return for the same (or lower) risk or if no other portfolio offers a lower risk for the same (or higher) return

  • the efficient frontier (above) represents the set of portfolios that will give you the highest return at each level of risk (or, alternatively, the lowest risk for each level of return).
  • anything below this line is an inefficient portfolio and is inferior in either risk or return or both to those which lie on the efficient frontier.

LOS 50g: Explain the concept of an optimal portfolio and show how each investor may have a different optimal portfolio

  • The optimal portfolio for each investor is at the point wher ethe investor's highest indifference curve is tangent to the efficient frontier.
  • the optimal portfolio is the portfolio that is the most preferred of the possible portfolios (i.e. the one that lies on the highest indifference curve)

NB the steeper the slope at the point of tangency, the greater the level of risk aversion because it takes more additional return to compensate for each additional unit of risk i.e. their indifferent curve will curl up on the right hand side more steeply the more risk averse they are

LOS 51b: Explain the capital market theory, including its underlying assumptions, and explain the effect on expected returns, the standard deviation of returns, and possible risk-return combinations when a risk free asset is combined with a portfolio of risky assets

The assumptions of capital market theory are:

  • Markowitz investors - all investors want to choose portfolios that lie along the efficient frontier, based on their utility functions
  • unlimited risk-free lending and borrowing
  • homogeneous expectations - everyone sees same risk-return functions
  • one-period horizon - all investors have same one-period time horizon
  • divisible assets - all investments are infinitely divisible
  • frictionless markets - no transaction costs or taxes
  • no inflation and constant interest rates
  • equilibrium - the capital markets are in equilibrium

Markowitz efficient frontier uses only risky assets. Adding the RF asset transforms it into a straight line because the big long formula for standard deviation of a two asset portfolio is transform into σp = Wm σm because there is no correlation between the RF asset and any of the others.

This straight line is called the capital market line (CML) and is essentially the efficient frontier plus various combinations of RF and Risky assets.

So the best possible mean and standard deviation combinations are from the riskless and tangency portfolio.

  • If 100% of your wealth is invested in the riskless asset, then you return is R_f and the standard deviation is zero.
  • If 50% of your wealth is invested in the riskless asset and 50% of your wealth is in the tangency portfolio, then your portfolio lies in between R_f and M on the straight line.
  • If 100% of your money is in the tangency portfolio, the your expected return is the expected return on the tangency portfolio and your standard deviation is the standard deviation on the tangency portfolio.
  • Finally, if you borrow money at the riskless rate and combine your borrowing with your initial wealth to buy the tangency portfolio, then your portfolio is to the right of M on the straight line. This is a levered position.

This straight line is called the Capital Market Line.

  • Since total lending equals total borrowing in the economy, the tangency portfolio is the market portfolio.
  • The market portfolio represents total invested wealth in risky assets. It is a portfolio with weights defined to be the total value of the asset divided by the total value of all risky assets. These weights are referred to as value weights.

LOS 51b: Identify the market portfolio and describe the role of the market portfolio in the formation of the capital market line (CML)

  • all investors have to do to get the risk/return combination that suits them is the vary the proportion of their investment in the risky Portfolio M and the RF asset
  • since all investors see risk-return using the same method, they all see the optimal risky portfolio as being the market portfolio that lies tangent between the efficient frontier and the CML
  • all investors want to hold some combination of the RF asset and the market portfolio
  • the market portfolio includes all risky assets and is therefore completely diversified.

LOS 51c: Define systematic and unsystematic risk and explain why an investor should not expect to receive additional return for assuming unsystematic risk

  • unsystematic risk is the firm-specific risk that can be diversified away
  • systematic risk is the risk that is inherent in the system and cannot be diversified away. If your stock is very responsive to market changes (e.g. luxury goods) you have a high systematic risk
  • total risk = systematic risk + unsystematic risk

Studies have shown that it takes around 18-30 stocks to achieve 90% of total possible diversification

  • One conclusion from capital market theory is that equilibrium security returns depend on a stock's or a portfolio's systematic risk, not its total risk as measured by standard deviation.
  • The riskiest stock does not necessarily have the highest return; you are rewarded only for systematic risk not unsystematic risk since unsystematic risk can be diversified away for free

LOS 51d: Explain the CAPM, including the security market line (SML) and beta and describe the effects of relaxing its underlying assumptions

  • SML is a described by a stock or portfolio's Beta and its expected return and is a graphical representation of CAPM.
  • Beta is systematic risk i.e. how responsive is a stock or portfolio to market movements
  • All properly price securities will plot on the SML because the SML is really just a graphical representation of the CAPM i.e. the required return based on a securities Beta

LOS 51e: Calculate, uing SML, the expected return on a security and evaluate whether the security is overvalued, undervalued or properly valued

  • if they are underpriced, they will plot above the SML because the expected return is higher than the required return. if they are overpriced, they will plot below the SML because the expected return is lower than the required return based on the security's beta.
  • CAPM determines required return so if stock is forecast to be $10 and CAPM has it at $8 then buy the stock.

! ! ! Differences between the CML and the SML

  • CML measures the efficiency of a portfolio i.e. the tradeoff between Expected Return and Total Risk (unsystemic risk + systemic risk)
  • Efficient portfolios will plot along the CML meaning that there is not a better combination that will produce a better tradeoff for the amount of risk or expected return
  • Below the market portfolio, you have some of your investment in RF assets (lending).
  • At the market portfolio, you have everything in risky assets but it is as diversified as risky assets can get i.e. the systematic risk should be nil
  • Above the market portfolio, you are borrowing money to purchase portions of your portfolio of risky assets so you are in a levered position which means that both your risk and expected return will be higher
  • Inefficient portfolios will plot beneath the CML because there is a better combination; nothing will plot above the CML because it would mean that there were a better combination at a higher point and the CML itself would move up
  • SML measures systemic risk only i.e. how a security's Beta (systemic risk) affects its expected return. It does not measure unsystemic (or firm-specific) risk which can be diversified away for free.
  • SML is a measure of required return based on the Beta of a security and therefore all properly priced securities will lie on the SML (if forecast plots it above then underpriced because exp. return is higher than required return and vice versa)
  • The CAPM (SML) is an equilibrium model that predicts the expected return on a stock given the expected return on the market, the stock's Beta and the risk free rate
  • A low beta stock is not necessarily a low risk stock e.g. pharmaceutical researcher
  • Any asset on the SML is expected to earn the market return

Relaxing the CAPM assumptions changes the model's implications:

  • the CAPM cannot be derived without equal borrowing and lending rates, unless investor's can create a zero beta portfolio (e.g. RF assets)
  • positive transaction costs, heterogeneous expectations, and multi-period investment horizon will each produce a Security Market band rather than a SML
  • Introducing taxes with different tax rates for different investors produces heterogeneous after-tax returns expectations and results in different SML's for different investors

Monday, March 1, 2010

Corporate Finance - Study Session 11

Review Notes:
  • Know the relationship between BDY, BEY, HPY and EAY well i.e. what the drawbacks are of each and which gives higher or lower results relative to the others.
  • Know how to calculate BDY, BEY, HPY and EAY very well
  • The money market yield (MMY) is the holding period yield (HPY) times 360/t and is always greater than the discount yield (BDY) which is the actual discount from face value times 360/t, since the holding period yield is always greater than the percentage discount from face value. A security’s BDY and MMY always <>, and its EAY always > BEY.
  • So EAY > BEY > MMY > BDY
  • For pricing debt or equity, use market price rather than face value or book value
  • weak on finding the Beta for a project calculation - probably just a brute for memorization

LOS 44b - Discuss the basic principles of capital budgeting, including the choice of the proper cash flows

Capital budgeting includes 5 key principles:
  1. Decisions are based on cash flows, not accounting income; so take into account incremental cash flows; do not consider sunk costs such as market research into a potential new product; consider negative externalities such as cannibalisation and positive ones which may boost another product.

    conventional cash flow pattern = negative first cash flow, positive cash flows from then on
    unconventional cash flow pattern = sign on the cash flow changes more than once
  2. Cash flows are based on opportunity costs e.g. account for the cost of the company-owned land that a proposed new building would occupy
  3. Timing of cash flows - earlier cash flows are more valuable than later ones
  4. cash flows are analysed on an after-tax basis - we want to know what we keep from the project
  5. financing costs are already reflected in the required rate of return i.e. the discount rate used in the capital budgeting analysis takes account of the firms cost of capital; only projects expected to return more than the cost of capital needed to fund them will increase the value of the firm

LOS 44c - Explain how the following project interactions affect the evaluation of a capital project:

  1. Independent versus Mutually Exclusive Projects Independent projects are unrelated to one another and can be evaluated based on their own profitability. Mutually exclusive projects = only one project in a set of projects can be accepted.
  2. Project Sequencing Just as it sounds. the order of projects is important. choosing a certain project now may provide opportunities for other projects if profitable. If unprofitable, it precludes the other project.
  3. Unlimited Funds versus Fund Rationing If you have unlimited money, choose the projects which will make more than the cost of capital. With constraints on money, you will have to prioritise projects and ration money to those projects that make the most monetary sense.

LOS 44d - Calculate and interpret the results using each of the following to evaluate a single capital project: NPV, IRR, payback period, discounted payback period, and profitability index (PI)

NPV is the sum of all the present values (including any initial negative outlay) of the expected incremental after-tax cash flows if a project is undertaken, discounted at the firm's cost of capital (adjusted for risk). A positive NPV is expected to increase shareholder wealth and vice versa. For independent projects, the NPV decision rule is to accept any project with a positive NPV

IRR is the discount rate that makes the after tax PV of all the cash flows (discounted at the firm's cost of capital) equal to the initial cost of the project i.e. makes PV(inflows)=PV(outflows) and therefore is the discount rate that makes the NPV = 0. IRR Decision Rule (1) determine required rate of return for a project (usually firm's cost of capital adjusted for risk) and (2) if IRR > cost of capital then accept.

Payback Period (PBP) is the number of years it takes to recover the initial cost. You may be given a Cumulative Net Cash Flows (NCF) table which is a running total of how much you have paid down on the initial cost or how much profit you have made. If the breakeven point is between two years, divide the NCF at the start of the year by the next cash inflow (the next year) e.g. -400/1200 will give you 0.333 of a year.

PBP Decision rule Payback period is about liquidity i.e. when will i have the money back so i can do something else with it. It is not for accept/reject because it does not take into account time value of money or cash flows beyond the payback period (so terminal/salvage value wouldn't be included).

Discounted Payback Period = # of years it takes to pay back intial outlay in PV terms and therefore is always greater than non-discounted PBP. Addresses TMV drawback of PBP but does not address the other concerns.

Profitability Index (PI) = the PV of a project's future cash flows divided by the initial cash outlay. i.e. PI = PV of future cash flows including intial cash flow/initial cash flow = CF0 + NPV/CFo

If NPV is positive then PI will be greater than one. Therefore, if PI > 1.0 accept the project.

  • So if NPV is positive, IRR will be greater than cost of capital and PI will be > 1.0

LOS 44e: Explain the NPV profile, compare and contrast the NPV and the IRR methods when evaluating independent and mutually exclusive projects, and describe the problems associated with each of the evaluation methods

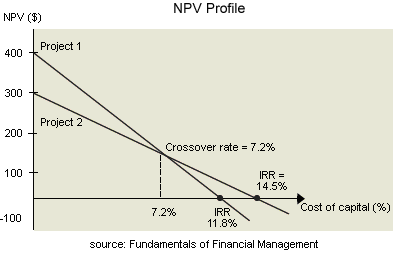
  • NPV profile depicts the NPV of (multiple) projects at varying costs of capital. The cost of capital is along the x axis so the IRR will be where the NPV profile intersects the x axis i.e. where NPV = 0
  • NPV profiles intersect where their NPV's are equal (the crossover rate); in the below profile, project 1 has a higher NPV at discount rates lower than 7.2% and project 2 has higher NPV at discount rates higher than 7.2% (so the discount rate determines which project has a higher NPV)
  • The NPV profiles intersect because of the timing of their cash flows; the NPV of a project (e.g. project 1) will fall faster if it has later cash flows than another project (project 2)

key advantage of NPV = direct measure of the expected increase in shareholder value (therefore, preferred method). disadvantage = does not tell you the size of the project e.g. a project that cost a $1,000,000 but has a positive NPV of $10 is probably not a wise investment

key advantage of IRR is that it solves the latter problem; measures profitability as a percentage i.e. return on each dollar invested. We can tell how far the project has to fall before it becomes uneconomical/ distadvantage: (1) can produce different rankings than NPV approach for same projects (2) possibility that there are multiple IRR's or no IRR for a project (due to unconventional cash flows for projects with positive NPV)

when in doubt (for mutually exclusive projects) use NPV IRR can be huge for a very small project e.g. investing $10 and making $100 might give you an IRR of 85% but only increases shareholder value by $90 whereas a large investment of a smaller IRR (say 20% IRR on a million bucks) is obviously a better investment.

NPV implicitly assumes that the money made could be reinvested at the discount rate used which is realistic whereas IRR implies it could be reinvested at the IRR rate which is not realistic.

LOS 44f: Describe and account for the relative popularity of the various capital budgeting methods and explain the relation between NPV and company value and stock price

Capital budgeting method varies according to:

Location European countries tend to use PBP method as much as IRR/NPV

Sophistication - the more sophisticated the company (size/education/private) the more likely the IRR/NPV method is used

Relationship between NPV and Stock Price

in theory, a positive NPV should cause a proportionate increate in a company's stock price. e.g.

  • if share price is $10 with 1000 shares outstanding then value = $10,000
  • if NPV of new project is $2000 then new value of company = $12,000
  • new share price = 12,000/1000 = $12

in reality, share price is more function of expectations about earnings so announcement of NPV positive project may cause share price to drop if NPV is less than expect or it might rise disportionately if the project signals other projects or expectations

LOS 45a: Calculate and interpret the weighted average cost of capital (WACC) of a company

Calculate WACC = (wd)[kd(1 - t)] + (wps)(kps) + (wce)(kce)

where:

  • wd = weight of debt
  • kd = cost of debt
  • t = marginal tax rate
  • wps = weight preferred stock
  • kps = cost of preferred stock
  • wce = weight common equity
  • kce = cost of common equity

WACC gives you the opportunity cost of capital or the discount rate for discounting future cash flows when capital budgeting

  • For any given project, your IRR should be higher than your WACC in order to approve the project
  • If your project is riskier than the risk of the projects that make up the firm, the WACC may need to be revised upward or vice versa

LOS 45b: describe how taxes affect the cost of capital from different capital sources

Interest paid on debt is often tax deductible hence the debt is often discounted by 1-t (which decreases the cost of debt by the marginal tax rate). Other sources of capital (ps and ce) are not typically tax deductible so they are not discounted.

LOS 45c: Describe alternative methods of calculating the weights used in the WACC, including the use of the company's target capital structure

  • WACC should be based on firm's target capital structure - the weights (based on market values) of debt, ps, and ce the firm expects to achieve over time
  • if no info is available, use firms current structure
  • if there is a trend (e.g. firm has been increasing debt) then follow that trend in your weighting system
  • otherwise use industry average capital structure as target structure for firm

LOS 45d: Explain how the marginal cost of capital and the investment opportunity schedule are used to determine the optimal capital budget

  • Company creates wealth for shareholders by earning more on its investment in its assets than is required by those who provide capital to the firm (the WACC)
  • Marginal Cost of Capital (cost of raising capital) generally increases as larger amounts are invested - hence the upward sloping marginal cost of capital curve
  • Expected returns (IRR's) of potential projects can be ordered from highest IRR to lowest IRR to create a downward sloping investment opportunity schedule
  • where the MCC curve intersects the investment opp schedules is the optimal capital budget which makes sense because the firm should take on all projects with an IRR greater than the cost of capital

LOS 45e: Explain the marginal cost of capital's role in determining the NPV of a project

  • WACC is the appropriate discount rate for projects with the same level of risk as the firm's existing projects; WACC's should be adjusted up/down for higher/lower risk projects
  • implicit assumption that capital structure of a firm will remain the same over the span of the project
  • NPV should be calculated using the WACC/Marginal Cost of Capital and those projects with a positive after tax NPV should be accepted

LOS 45f: Calculate and interpret the cost of fixed rate debt capital using the YTM approach and the debt rating approach

  • After-tax cost of debt is the rate, kd(1 - t) is the interest rate at which firms can issue new debt net of the tax savings
  • Cost of debt is the market interest rate (YTM) of new (marginal) debt, not coupon rate on firm's existing debt
  • if YTM is not available (e.g. debt is not publicly traded), analyst may use the rating and maturity of the firm's existing debt e.g. if firm's debt is rated AA with maturity of 15 yrs, you can use yield curve for AA rates debt with maturity of 15 yrs
  • if anything (e.g. covenants, seniority) affect the yeidl, adjust appropriately
  • for firms with floating rate debt, estimate the longer-term cost of the firm's debt using the current yield curve (term structure for the appropriate rating category)

LOS 45g: Calculate and interpret the cost of non-callable, non-convertible preferred stock

  • cost of preferred stock (kps) = Dps/P
  • where Dps is preferred dividends and P is market price

LOS 45h: Calculate and interpret the cost of equity capital using the capital asset pricing model approach, the divident discount model approach, and the bond-yield-plus risk-premium approach

All of these approaches measure the required rate of return on the firm's common stock - the opportunity cost of capital i.e. the firm can lower some of this part of the WACC by using retained earnings to buy back shares (lowering cost of common stock outstanding)

Hence all of these approaches are ways of valuing the cost of common stock

1) CAPM = RFR + B[E(Rm) - RFR]

  • RFR = Risk free rate
  • E(Rm) = expected return on the market
  • Beta is the stock's risk measure
  • this is another formula that makes sense when you break it down. it is the risk free rate plus the risk premium multiplied by the market risk

2) Dividend discount model approach

  • Po = D1/(kce - g)

where:

  • D1 = next year's dividend
  • kce = the required rate of return on common equity
  • g = the firm's expected constant growth rate

Rearranging the terms you can solve for kce = (D1/P0) + g

Use the growth rate projected by security analysts or estimate growth using:

  • g = (retention rate)(return on equity) = (1 - payout rate)(ROE)

this is also intuitive; the growth rate is the amout of ROE the firm will keep

3) Bond yield plus risk premium approach

ballpark figure constructed by adding a risk premium (3-5%) to the market yield on the firm's long term debt

  • kce = bond yield + risk premium of 3-5%

LOS 45i: Calculate and interpret the beta and cost of capital for a project

Project's beta = systematic or market risk; use project's beta to adjust for differences between a specific project's risk adn the average risk fo a firm's projects

Pure-play method = find a publicly traded firm purely engaged in the same biz as the project and begin with that firm's beta and then unlever it (to adjust for the company's dependence on debt financing) and then relever it based on the financial structure of the company evaluating the project. Then use this equity beta to calculate the cost of equity to be used in evaluating the project.

To get asset beta for publicly traded firm, discount the equity beta for the form by the after tax debt-to-equity ratio

  • ΒASSET = ΒEQUITY[1/1+(1(1-t)D/E)]

to get equity beta for the project, use the subject firm's tax rate and debt-to-equity ratio and re-lever the beta so...

  • BPROJECT = BASSET[1+((1-t)D/E)]

issues for this method:

  • beta is estimated using historical returns which may be sensitive to the length of time used
  • estimate is affected by the index chosen to represent market return
  • betas are believe the revert to 1 over time - need to account for this
  • estimates of betas for small cap firms may include a risk premium for risk of smaller firm not captured by usual estimation methods

LOS 45j: Explain the country equity risk premium in the estimation of the cost of equity for a company located in a developing market

CAPM is problematic in developing countries because Beta does not capture country risk premium

general risk of developing country is reflected in its sovereign yield spread (the difference between yields of sovereign debt and similar maturity Treasuries)

we must also adjust the sovereign yield spread by the ratio of the volatility of equities in dev country/volatility of sovereign bonds for that country (for bonds denominated in developed market's currency)

so revised CAPM: kce = B[E(Rmkt)-RFR+CRP]

where CRP is:
country risk premium = sovereign yield spread * (volatility dev. equities/ volatility dev. bonds in US$)

LOS 45k: Describe the marginal cost of capital schedule, explain why it may be upward sloping with respect to additional capital, and calculate and interpret its break points

  • marginal cost of capital schedule tends to be upward sloping because as a firm raises more and more capital , the costs of different sources of financing will increase
  • e.g. cost of debt may rise due to increased risk, convenant protecting seniority of earlier debt issues, flotation costs of issuing new stock
  • marginal cost of capital schedule shows the WACC for different amounts of financing
  • break points occur any tiem the cost of one of the components of the company's WACC changes and is calculated thusly:

break point =
amt of capital at which a component's cost of capital changes
weight of the component in the capital structure

LOS 45l: Explain and demonstrate the correct treatment of flotation costs

  • Flotation costs are a fixed one-off costs and should rightly be accounted for as part of the initial cost of the project and NOT as part of WACC in any way

Problem set issues:

  • calculate Marginal Cost of Capital
  • calculate ke using dividend discount approach

Reading 46: Working Capital Management

LOS 46a. describe primary and secondary sources of liquidity and factors that influence a company’s liquidity position;

  • primary sources of liquidity are the sources of cash the company usese in its day-to-day operations e.g. cash balances from sales of goods and services, collecting receivables and investment income. Short term funding includes trade credit from vendors and lines of credit from banks
  • secondary sources of liquidity indicates trouble e.g. liquidating short-term or long-lived assts, renegotiating debt agreements, filing for bankruptcy and restructured
  • drags and pulls drags on liquidity are things that delay/reduce cash inflows (bad debts, incollected receivables, obsolete inventory, etc.) pulls are things that accelerate cash outflows e.g. paying vendors sooner than is optimal

LOS 46b. compare a company’s liquidity measures with those of peer companies;

most of the comparisons are performed comparing the following ratios to industry norms

  • current ratio = current assets/current liabilities high ratio means better ability to pay short term bills; less than one means trouble
  • quick ratio = (cash + marketable securities + receivables)/current liabilities i.e. same as current ratio but only using the most liquid assets

Measures of how well a company is managing its working capital include:

  • receivables turnover = credit sales/average receivables
  • number of days of receivables = 365/receivables turnover
  • inventory turnover = COGS/average inventory
  • number of days of inventory = 365/inventory turnover
  • payables turnover = purchases/average trade payables
  • number of days of payables = 365/payables turnover
  • NB all of these are measures of turnover i.e. the item/average of the opposite measure e.g. COGS/avg inventory and the number of days is just 365/turnover
  • NB you want these to mostly be close to industry norms

LOS 46c. evaluate overall working capital effectiveness of a company, using the operating and cash conversion cycles, and compare its effectiveness with other peer companies;

  • operating cycle = number of days it takes to turn raw materials into cash proceeds from sales
  • operating cycle = days of inventory + days of receivables
  • cash conversion cycle or net operating cycle is the length of time it takes to turn the firm's cash investment in inventory back into cash, in teh form of collections from the sales of that inventory
  • cash conversion cycle = (avg days of receivables) + (avg days of inventory) + (avg days of payables)
  • NB high cash conversion cycles are undesirable - implies too much investment in working capital
  • NB understand what the ratios are saying about the business

LOS 46d. identify and evaluate the necessary tools to use in managing a company’s net daily cash position;

Need to ensure there is sufficient cash without letting it sit idle; answer is to keep much of it highly liquid, low risk securities etc. such as:

  • Treasuries
  • Bank COD's
  • Banker's Acceptances
  • Repurchase Agreements
  • Commercial Paper
  • Money Market Mutual Funds
  • Adjustable-rate preferred stock = stock which resets quarterly to current market yields and has tax advantage

LOS 46e. compute and interpret comparable yields on various securities, compare portfolio returns against a standard benchmark, and evaluate a company’s short-term investment policy guidelines;

  • % discount from face value = (face value - price)/face value
  • discount basis yield (or BDY) = % discount * (360/t)
  • money market yield = ((face value - price)/price)* (360/t) = HPY * (360/t)
  • bond equivalent yield = HPY * (365/t)

returns on firm's short term securities investments should be stated as BEY's. Return on portfolio should be expressed as weighted average of those yields

LOS 46f. assess the performance of a company’s accounts receivable, inventory management, and accounts payable functions against historical figures and comparable peer company values;

  • A firm's inventory, receivables, and payables management can be evaluated by comparing days of inventory, days of receivables, and days of payables for the firm over time, and by comparing them to industry averages or averages for a group of peer companies.
  • A receivables aging schedule and a schedule of weighted average days of receivables can each provide additional detail for evaluating receivables management.

LOS 46g. evaluate the choices of short-term funding available to a company and recommend a financing method.

Choices for short term borrowing depends on firm's size and credit-worthiness; options (in order of decreasing firm creditworthiness and increasing cost):

  • commercial paper
  • bank lines of credit
  • collateralised borrowing
  • nonbank financing
  • factoring (of receivables)

FINANCIAL STATEMENT ANALYSIS

LOS 47: Demonstrate the use of pro forma income and balance sheet statements

  • Pro forma income and balance sheet statements are forward-looking financial statements constructed based on specific assumptions about future business conditions and firm performance.
  • process begins with making an assumption about which variable is the overall driver (e.g. sales) of income and balance sheet items
  • e.g. if sales are forecast to increase by 10% then we could forecast that COGS, fixed assts, total assets, debt and interest expense etc. could increase by 10%
  • i.e. that the percentage of each relative to sales will be maintained

Constructing a sales-driven pro forma financial statement:

  1. Estimate the relation between change in sales and the changes in sales-driven income statement and balance sheet items
  2. Estimate the future tax rate, interest rate on debt, lease payements, etc.
  3. Forecast sales for the period of interest
  4. Estimate fixed operating costs and fixed financial costs
  5. Integrate these estimates into pro forma financial statements for the period of interest

To calculate future sales, you can:

  • calculate average compound growth rate of sales over 5 or 10 year period and use that rate to forecast future sales
  • regression analysis to estimate relationship between GDP growth and growth in sales and use economists' estimates of future GDP growth to forecast (assumes correlation)
  • economic cycles, seasonality of sales, specific events, changes in regulation/tax rate etc. can also be incorporated into model

We can move the financial statements through iterations based on "what if" scenarios such as what if the company decided not to pay dividends and yielded a surplus. Then what if this surplus was used to pay down debt? Interest payments would come down and more money would come in from the savings there... etc. etc.

The Corporate Governance of Listed Companies: A Manual For Investors

LOS 48a: Define and describe corporate governance

Corporate governance is the set of internal controls, processes, and procedures by which firms are managed. It defines the appropriate rights, roles, and responsibilities of the management, the board of directors, and shareholders within an organisation. It is the firm's checks and balances.

Good corporate governance seeks to ensure that:

  • the board of directors protects shareholders interests
  • the firm acts lawfully and ethically in dealings with shareholders
  • the rights of shareholders are protected and shareholders have a voice in governance
  • the board acts independently from management
  • proper procedures and controls cover management's day-to-day operations
  • the firm's financial, operating, and governance activities are reported to shareholders in a fair, accurate, and timely manner

LOS 48b: Discuss and critique characteristics and practices related to board and committee independence, experience, compensation, external consultants, and frequency of elections, and determine whether they are supportive of shareowner protection

Corporate governance is the set of internal controls, processes, and procedures by which firms are managed. Good corporate governance practices ensure that the board of directors is independent of management and that firm and its managers act lawfully.

LOS 48c: Describe board independence and explain the importance of independent board members in corporate governance

Majority of board should be independent but experienced enough to advise management and review its activities.

LOS 48d: Identify factors that indicate a board and its members possess the experience required to govern the company for the benefit of its shareholders

experience with:

  • the products or services the firm produces
  • financial operations, accounting, and auditing
  • legal issues
  • strategies and planning
  • firm's business and financial risks

LOS 48e: Explain the provisions that should be included in a strong corproate code of ethics and the implications of a weak code of ethics with regard to related-party transactions and personal use of company assets

  • code of ethics - practice what you preach;
  • comply with corp gov standards in home country and stock exchange;
  • no advantages to outsiders that are not available to shareholders;
  • have someone responsible for corp governance

LOS 48f: State the key areas of responsibility for which board committees are typically created and explain the criteria for assessing whether each committee is able to adequately repesent shareholder interests

  • Audit committee - proper account procedures, external independent auditor, free commuincations
  • Compensation committee - ensure fair and appropriate (not excessive) compensation which is linked to long term profitability; shareholder approval for share based compensation (dilution issues); be transparent about compensation
  • Nominations committee - recruitment of new, qualified board members; review existing board members; succession planning

LOS 48g: Evaluate, from a shareholder's perspective, company policies related to voting rules, sharehodler sponsored proposals, commons stock classes, and takeover defenses

  • don't make it difficult to vote proxies
  • confidence voting and remote proxy voting are good
  • takeover defenses are generally not in the shareholders' best interest

rules of thumb:

  • independence is good; promoting rights and interests of shareholders is good
  • any conflict of interest e.g.tie to management, consulting fees, personal loans from company, long-serving board members, family ties, cross-directorships, unreasonable compensation packages, chairman is also CEO = bad